When analysing a market for a new campaign or brand launch, diving straight into SAARF AMPS is a common place to start. Doing run after run will eventually lead to market insights, but only after you've dug your way out of an avalanche of information. An easier way to get an early understanding of your market is by doing a CHAID analysis using the TNT software.
Tree-building algorithm
CHAID is a tree-building algorithm used to classify a dataset. It's been around for a long time, but some have never even heard of it, let alone used it. A CHAID analysis is fantastic for strategy, because it gives you an immediate and accurate analysis of an extensive set of AMPS demographic categories against a desired target. It shows you the relationship between these demographics, so you're not looking at market characteristics in isolation.
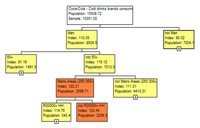
For example, if you wanted to determine the target market of Coca-Cola, a quick CHAID analysis using AMPS 2008AB would show that one of the core segments of Coca-Cola drinkers are more likely to be men, under 50, living in metropolitan areas, with a household income of less than R20 000.
CHAID shows you, at a glance, who is the more likely consumer of your product or media - the demographics most pertinent to your analysis - so you know from the beginning which areas of the AMPS data to mine first.
Comparing brands
Invaluable when first looking into a market, CHAID is also useful when you're comparing brands. Rather than doing runs on each competitor brand and then trying to draw conclusions from pages of figures, a CHAID analysis will reveal the key features of each competitor's market.
A CHAID analysis gives you a visual understanding of the relationship between your market's key demographics, which is particularly useful when you're explaining your insights to clients.
Planners, however, must be aware of the sample sizes, especially when using brands. If samples are too small, the data will be skewed, so keep an eye on this as you work your way down the CHAID tree.
To run a CHAID analysis on TNT+, add the brands or products you're investigating to the “table”, and insert all potential variables, such as demographics, attitude or value statements, in the “columns”. Click on “File”, and select “CHAID” from the drop-down menu, then choose your preferred display - tree or org chart.