
Customer satisfaction increases in the telecommunications industry
The Synovate SAS Index™ (South African Satisfaction Index) results for the telecommunications industry have been released, showing an increase in customer satisfaction with customer service across all the telecommunication providers. Overall satisfaction in the industry has increased from 79% in November 2005 to 82% this year.
"This is great news for the telecommunications industry," states Debbie Amm, Client Services Director at Synovate. "While the telecommunications industry has always enjoyed very high satisfaction levels from its customers (the highest across all the industries measured by SAS Index™), it is assuring to see that the service providers are not resting on their laurels. This is especially significant ahead of Mobile Number Portability (MNP) - being introduced tomorrow."
SAS Index™ was developed by Synovate to address the lack of transparency about service levels in South Africa. It is a public and common measurement of service levels in various industries, including telecommunications, municipalities, short and long term insurance, medical aids and banks. The measurement has been developed using scientific principles and is aligned with similar measures in Europe (EPSI) and America (ACSI), which allows for global comparisons.
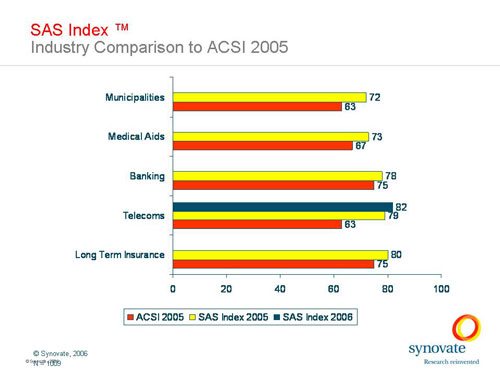
The South African Satisfaction Index™ telecommunications study was launched by Synovate and The Department of Trade and Industry in 2001. The study measures customer satisfaction levels with cellular service providers, Vodacom, MTN and Cell C and fixed line operator, Telkom.
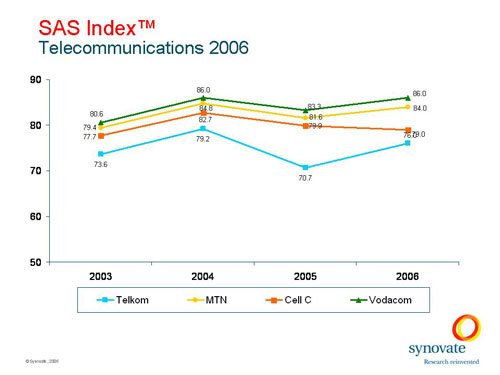
Vodacom enjoys the highest levels of overall satisfaction amongst its customers and has shown the most significant increase amongst the cellular service providers. Overall satisfaction with Vodacom has risen from 83% in 2005 to 86% in 2006. MTN has also shown an increase and overall satisfaction stands at 84% (up from 82%). Vodacom and MTN have retained their rankings in first and second positions respectively for all five years. Cell C's overall satisfaction score stands at 79% (80% in 2005).
"The battle for customers should see customer satisfaction levels in the Telecommunications Industry increase in the future," says Amm. "With the increased competition from Neotel as well as Virgin Mobile, we are certain to see the telecommunications players up their game even more."
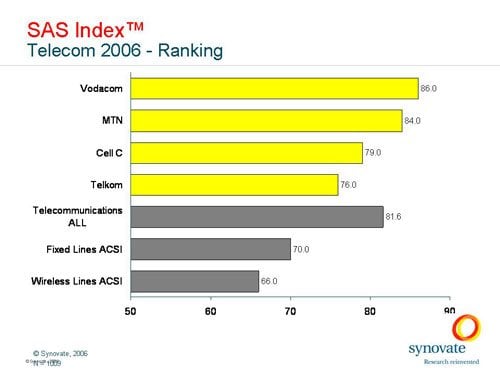
Telkom has shown a marked improvement and its overall satisfaction index has risen from 71% to 76%, an improvement that has been driven by most of the factors measured by the survey - which have all shown increases in satisfaction levels amongst consumers. This includes:
Staff improvements are evident for both MTN and Telkom (83% and 76% respectively). Specifically, MTN have upped the stakes in terms of friendliness and general helpfulness of its staff - this score has increased 82% to 86%. Telkom's score has increased for the overall quality of its staff - from 74% in 2005 to 77%.
In terms of products and services, the availability of distribution points of recharge cards and vouchers has yielded higher levels of satisfaction. While this is true of all the telecoms players, the most notable development in this area has been by MTN, whose score has risen from 85% in 2005 to 88% in 2006.
Vodacom's improvements lie mostly in its point of sales and activation. Its score for the availability of its products at outlets (such as stores and outlets) has gone up from 84% in 2005 to 86% in 2006.
The industry as a whole has also shown progress in pleasing its customers in terms of consumer rights and protection. This is especially true of Telkom, who received an overall score of 76% (up from 72% in 2005). Telkom has impressed customers with honest communication and provision of the necessary facts to make informed choices. This is compared to MTN's and Cell C's scores of 81% and Vodacom's score of 84% for overall consumer rights and protection.
Telkom customers have also shown an increased tolerance for the rates Telkom offers for its services. The statement that it offers services at competitive rates has yielded a score of 70%- up from 61% last year.
Satisfaction Determinants:
Although perceived value from the telecoms players is still the lowest score in the survey, this has risen from 71% in 2005 to 76% in 2006. Attributes measured within this include reasonable costs and value for money. Consumers have experienced a vast improvement from Telkom although these satisfaction levels are still not as good as the other 3 providers. Agreement with the statement that costs are reasonable increased from 53% to 63%. It must be kept in mind that Telkom's product range has recently expanded to include not only telephone lines but also DSL, Internet, ISDN and VPN, to name a few. This may have impacted on their perceived service value.
Likewise, Vodacom appear to be pleasing their customers with its costs. This year 78% of their customers agree that costs are reasonable and 81% agree that Vodacom offer value for money.
Perceived quality has also increased slightly. The improvements in this area come mostly from Telkom, whose customers are increasingly impressed with the customised service Telkom is able to offer as well the overall quality of its service.
MTN and Cell C have raised the bar in terms of satisfying customer expectations. Scores for expectation have increased to 84% for MTN (82% in 2005) and to 82% for Cell C (79% in 2005). Vodacom's and Telkom's customer expectation scores have remained unchanged at 81.5% and 77% respectively since the previous reading in 2005.
The telecommunications industry as a whole has retained the levels of customer loyalty at 81%. However, there is a slight decrease in loyalty amongst Vodacom's customers - which has dropped from 87% in 2005 to 84% in 2006. Cell C's loyalty score has decreased from 80% to 79%. MTN currently enjoys the highest degree of customer loyalty, with a score that has increased from 84% last year to 86% in 2006.
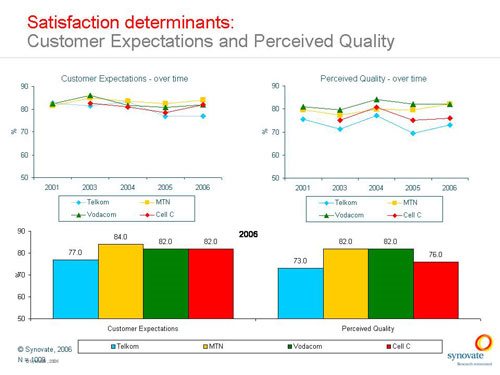
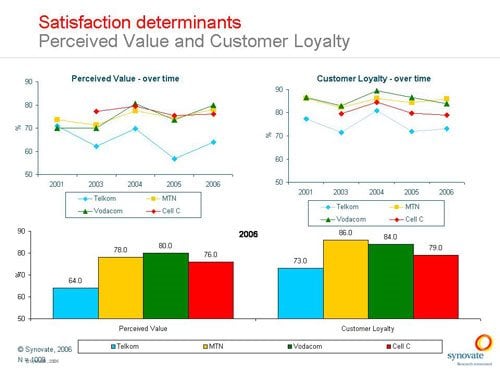
"In building a loyal customer base, it is important to remember that expectations impact directly on satisfaction and loyalty," concludes Amm. "As customer expectations rise, it becomes harder to maintain satisfaction levels. The high level of satisfaction and loyalty in the face of such high consumer expectation is no small accomplishment for the telecommunications industry."
About the Survey
This study comprised a total of 1 009 interviews, telephonically conducted nationally from August to September in 2006. The sample was split between the networks as follows:
| - | Sample |
| Telkom | 252 |
| Vodacom | 253 |
| Cell C | 253 |
| MTN | 251 |
| Total | 1 009 |
The rating scale used in the research offers respondents a rating scale of 1 - 10. A statement will be read to the respondent describing one aspect of the encounter with the service provider. The customer will then rate their experience on this scale - 10 indicating an excellent rating and 1 indicating a very dissatisfied rating. These ratings are then converted to percentages in the analysis stage.
For comments on these results, please contact Debbie Amm on 011 709 7800.
Ipsos is an innovative, entrepreneurial, client-focused organisation, providing research services to clients on a global basis. We set ourselves high standards and aim to work collaboratively in partnership with our teams in order to service our clients most effectively.
- Unlocking the value of creativity in advertising: How to bridge the creativity gap15 Apr 13:47
- 4 habits keeping your brand poor26 Mar 16:08
- Understanding consumer mindsets for growth in 202407 Mar 08:52
- South Africa's unemployment nightmare: The burden on its people09 May 10:05
- Global survey shows shrinking trust in internet29 Nov 10:17


