Top stories


More news


With most South Africans staying at home it is fair to assume that they will not only choose to shop for essential items closest to their home but opt for a store that they can spend less time at, thus probably avoiding larger shopping centres.
Using aggregated and anonymised vehicle movement data from Tracker, data analytics company Lightstone analysed changes in shopper behaviour at shopping centres across the country. According to Linda Reid, head of data at Lightstone, all shopping centres are experiencing lower volumes of visitors, but how has their share of the lower volume changed?

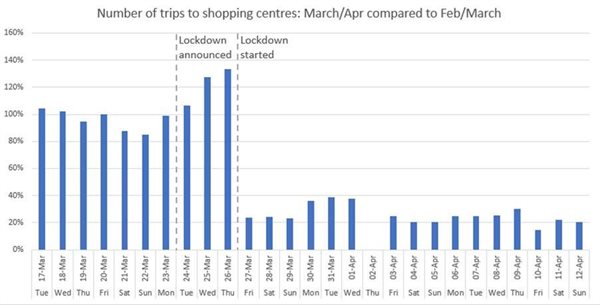
Lightstone discovered that on average, shopping centres that have a grocery store had 66% fewer trips during the first week of lockdown when compared to a typical week before the lockdown. "Prior to lockdown, major shopping centres were averaging 16,6 million trips in a six-day period (with the Tracker sample weighted up to represent the full country), however the first six days of lockdown saw this number drop dramatically to only 5,7 million trips, with provincial differences ranging from -59% (Eastern Cape) to -68% (Western Cape),” says Reid.
Further analysis of the data showed that not all shopping centres with grocery store presence dropped by the same amount; there is a definite shift of activity towards convenience shopping centres that are closer to residential areas than those located in business districts. Lightstone says the map below explains this in more detail; analysis looked at what portion each shopping centre received of the province’s visits before the lockdown, versus the share of the province’s (reduced) visits after lockdown.
• Shopping centres where that share remained the same, have maintained their market share (of a diminished 'pie') and are white on the map
• Shopping centres where that share dropped by between 5% - 25% are light blue and the dark blue and grey markers indicate shopping centres where severe loss in share of visits have occurred
• Shopping centres where that share increased by 5% - 50% are green to yellow, with red ones indicating dramatic increase in share
Reid says it's important to remember that although these shopping centres may be enjoying a bigger share, the share of the 'pie' is still vastly diminished resulting in total business still being significantly impacted.

The map further indicates that business-focused hubs like Sandton, wealthier residential suburbs along William Nicol from Rosebank, through Bryanston, into Fourways has seen a decreased share in visits. Lightstone evaluated whether this is as a result of pre-lockdown stockpiling (which wealthier people were more likely to do in comparison to those with lower incomes) and found that these shopping centres also had a lower number the week prior to lockdown, so stockpiling can be overruled here.
Suburban areas outside of the ring road that circles Johannesburg CBD are gaining shares where these shoppers would, pre-lockdown, have frequented the centres closer to where people work in the city.
“Townships seem to be a mixed bag,” says Reid. “Shopping centres in Soweto and Mamelodi have mostly increased their share, but Diepsloot and Tembisa shopping centres seem to have a lower share than before the lockdown.”
Lightstone utilised Tracker data to drill down further into the townships to evaluate why. During the first two days of lockdown, those township stores showed a strong market share gain as many received their salaries. “Perhaps shopping patterns differ compared to other areas, and people spent their money in the first two days because they could not stockpile,” Reid explains.
“Another scenario could be that consumers are shifting their buying patterns to purchase from local spaza shops for smaller needs in between weekly or biweekly trips for larger amounts.”
“It is encouraging to see that South African citizens continue to observe the letter and spirit of the lockdown rules,” adds Michael du Preez, executive: product and marketing at Tracker South Africa.
“The insights developed in conjunction with Lightstone suggest that South African citizens are making significantly fewer (but perhaps longer) shopping visits, most likely triggered by the personal motivation to minimise exposure frequency or because of longer queues as shops limit the number of shoppers allowed into their stores at any one time. We encourage citizens to continue to protect and care for themselves," he concludes.